
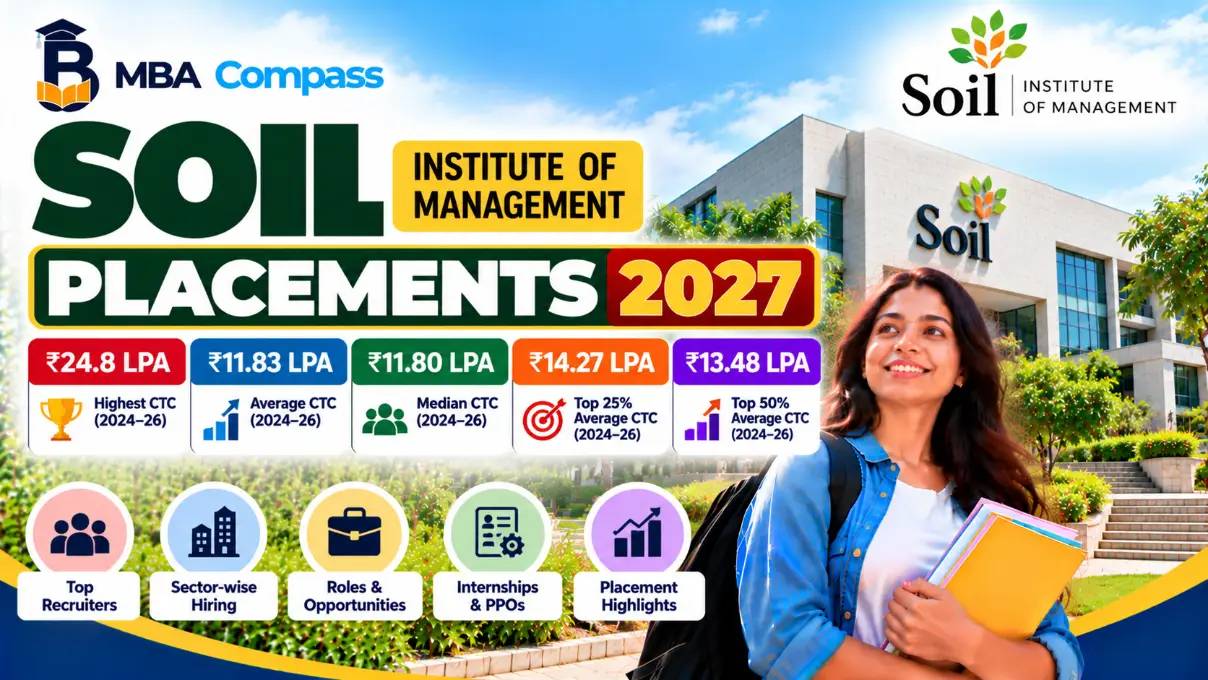
Overview: what these placement numbers show
The SOIL Institute of Management PGDM placement report for the 2024–26 graduating cohort presents headline outcomes that help applicants set expectations: a published highest CTC of ₹24.8 LPA, a published average CTC of ₹11.83 LPA, and a published median CTC of ₹11.80 LPA.
The same official programme page also lists ₹14.27 LPA for the top 25% and ₹13.48 LPA for the top 50% of the PGDM batch. These figures apply specifically to the two-year PGDM programme and are drawn from the institute's published placement disclosures for that batch (published on programme pages and summarised in recent placement reports updated in Oct–Nov 2026).
Below is a compact table that records each published headline together with its programme and reporting batch.
| Parameter | Published Figure | Programme | Reporting Batch |
|---|---|---|---|
| Highest CTC | ₹24.8 LPA | SOIL Institute of Management PGDM | 2024–26 |
| Average CTC | ₹11.83 LPA | PGDM | 2024–26 |
| Median CTC | ₹11.80 LPA | PGDM | 2024–26 |
| Top 25% CTC | ₹14.27 LPA | PGDM | 2024–26 |
| Top 50% CTC | ₹13.48 LPA | PGDM | 2024–26 |
Interpretation: the average and median are almost identical, which indicates a relatively symmetric reported distribution around the ₹11.8–11.9 LPA mark for the PGDM cohort; upper-quartile figures show that the better-performing 25% reported CTCs near ₹14.3 LPA. Applicants should treat these numbers as programme-specific historical benchmarks and compare them with programme fees, role types and eligibility rules before using them to judge ROI.
update: These PGDM figures are taken from SOIL's programme placement disclosures and third-party summaries updated Oct–Nov 2026; verify the institute's official 2027 placement report when published for cohort-specific final results.
What the figures represent: CTC, median, top quartiles
SOIL Institute of Management's published placement numbers describe reported annual compensation benchmarks for specific graduating cohorts and programmes. The two-year PGDM placement page explicitly labels its figures as annual CTC for the 2024–26 batch: a highest CTC of ₹24.8 LPA, an average CTC of ₹11.83 LPA and a median CTC of ₹11.80 LPA (official programme report, published 2026).
CTC (cost to company) is the headline annual compensation that an employer reports; it commonly includes fixed pay, variable components, bonuses and employer contributions and is not identical to monthly take-home pay. Median CTC is the midpoint of the reported salary distribution and is less sensitive to extreme high or low offers than the arithmetic mean.
SOIL's published upper-batch figures add context: the institute reports ₹14.27 LPA for the top 25% and ₹13.48 LPA for the top 50% of the PGDM batch (2024–26). These percentiles show the earning level for stronger-performing segments rather than the whole cohort average.
Below is a concise comparison table of the PGDM placement metrics the institute published for the 2024–26 cycle.
| Metric | Published value | Batch / Programme |
|---|---|---|
| Highest CTC | ₹24.8 LPA | PGDM, 2024–26 |
| Average CTC | ₹11.83 LPA | PGDM, 2024–26 |
| Median CTC | ₹11.80 LPA | PGDM, 2024–26 |
| Top 25% CTC | ₹14.27 LPA | PGDM, 2024–26 |
| Top 50% CTC | ₹13.48 LPA | PGDM, 2024–26 |
Practical interpretation: when average and median are nearly identical, as here, the distribution is comparatively symmetric and not dominated by a single outlier. The top-25% and top-50% figures indicate the salary band for the stronger half and quartile; they help applicants assess whether most high-paying roles are concentrated in a narrow segment or spread across the upper half. For applicants, median and percentile figures therefore provide a more reliable expectation of likely outcomes than the highest CTC alone.
SOIL PGDM placements 2024–26: reported figures
The published placement report for SOIL Institute of Management's two-year PGDM (Manesar campus) for the 2024–26 batch lists finalised salary outcomes across standard Overview metrics. These are programme-specific figures from the institute's official PGDM placement page and related verified reports updated in 2026.
Below is a concise table of the reported headline numbers.
| Placement Parameter | Published Figure | Reporting Batch | Notes |
|---|---|---|---|
| Highest CTC | ₹24.80 LPA | 2024–26 | Displayed as the single largest reported offer on the official PGDM placement page (final placement report). |
| Average CTC | ₹11.83 LPA | 2024–26 | Arithmetic mean of reported PGDM offers in the published report. |
| Median CTC | ₹11.80 LPA | 2024–26 | Midpoint of the published salary distribution for the PGDM batch. |
| Top 25% CTC | ₹14.27 LPA | 2024–26 | Published upper-quartile figure for the PGDM cohort. |
| Top 50% CTC | ₹13.48 LPA | 2024–26 | Published median-of-upper-half figure; labelled as top 50% on institute page. |
Interpretation: the average and median for the PGDM 2024–26 cohort are nearly identical, indicating a relatively symmetric reported distribution without extreme skew from the highest offer. The top 25% and top 50% numbers provide useful context above the median when assessing upper-batch outcomes.
Cross-check fees and total cost when calculating ROI via the SOIL fee breakdown: SOIL Institute of Management fees 2027: Tuition, Hostel & Charges
PGPM and PGPM-HR: separate placement outcomes
SOIL Institute of Management publishes distinct placement reports for its one-year programmes; the PGPM and PGPM-HR outcomes must be read separately from the two-year PGDM numbers.
Below is a concise table of the headline figures SOIL published for the most recent reported cohorts. All figures are taken from programme-specific placement pages and related official disclosures updated in October 2026.
| Programme | Reporting Batch | Highest CTC | Average CTC | Top25 | Top50 |
|---|---|---|---|---|---|
| PGDM | 2024–26 | ₹24.8 LPA | ₹11.83 LPA | ₹14.27 LPA | ₹13.48 LPA |
| PGPM (one-year) | Class of 2026 | ₹25 LPA | ₹13.9 LPA | ₹18.85 LPA | ₹16.4 LPA |
| PGPM-HR (one-year) | Class of 2025 | ₹20 LPA | ₹11.2 LPA | ₹16.5 LPA | ₹13.7 LPA |
These programme-level figures show that the one-year PGPM cohort reported a stronger headline average and upper-quartile performance than the PGDM in the cited cycles, while PGPM-HR tracks close to PGDM on average but shows higher top-quartile numbers for HR specialisation.
For programme structure and duration confirmation, consult the detailed course page: SOIL Institute of Management Courses & Programs 2026.
Interpret these differences in light of cohort composition: PGPM class profiles typically include experienced professionals, which concentrates higher mid-to-upper salary bands; PGDM is fresher-heavy and therefore shows lower mid-batch averages but a similar upper-envelope offer range.
Representative recruiters and sector split
SOIL Institute of Management's published PGDM placement report (final figures for the 2024–26 batch) lists representative recruiters and a sector-wise distribution for the cohort. The table below reproduces the sectors and their published shares along with example recruiters shown on the official placement pages updated in 2026–2027.
| Sector | Published Share | Example Recruiters |
|---|---|---|
| IT and ITES | 33% | Accenture, Wipro, Infosys, Tech Mahindra |
| BFSI | 30% | HDFC Bank, ICICI Bank, BlackRock, Bajaj Finserv |
| Consulting | 7%* | Deloitte, KPMG, Accenture (consulting roles) |
| Manufacturing | 7% | Maruti Suzuki, Asian Paints, Mahindra AFS |
| Edtech | 4% | BYJU'S, BYJU's affiliate listings |
*The official report groups consulting and professional services; the published share for consulting roles is shown as 7% on the SOIL PGDM placement page. All sector shares and recruiter names above are taken from SOIL's published placement material and contemporaneous placement summaries updated Oct–Nov 2026.
Interpretation: technology and BFSI together accounted for roughly two-thirds of reported offers, indicating that most entry-level roles were across IT/technology-enabled services and financial services. Consulting and manufacturing offered smaller but visible pipelines; Edtech and FMCG hire in lower volume but include marquee names. Applicants should map these sector shares to the functions and roles they prefer rather than treating the presence of a recruiter as a guarantee of a role in a specific function.
Function-wise roles and what they imply for career fit
SOIL Institute of Management placement data shows a clear functional mix that helps applicants match programme strengths to career goals. Strategy and consulting, business development, general management, human resources, operations, research/analytics, finance and marketing are the main buckets reported for the PGDM Class of 2024–26.
Below table reproduces the published functional distribution and common job titles seen in the official placement reporting (PGDM, 2024–26).
| Function | Published Share | Typical Job Titles |
|---|---|---|
| Strategy and consulting | 23% | Consultant, Strategy Analyst, Business Analyst |
| Business development | 20% | Business Development Executive/Manager, Sales Strategy |
| General management | 17% | Management Trainee, Associate Manager |
| Human resources | 14% | HR Executive, Talent Acquisition, L&D Coordinator |
| Operations | 11% | Operations Executive/Manager, Supply Chain Analyst |
| Research and analytics | 7% | Research Associate, Data Analyst |
| Finance | 6% | Financial Analyst, Business Finance Associate |
| Marketing | 3% | Marketing Analyst, Brand Executive |
Practical interpretation: applicants targeting consulting or strategy should note the strong 23% share in that function and prepare case and problem-solving skills; candidates aiming for BFSI or fintech roles should emphasise finance and analytics but also consider the sizeable placement flow into business development and IT/ITES recruiters. Those seeking HR roles can rely on a relatively high 14% share, reflecting SOIL's HR recruiter network; select PGPM-HR if HR specialisation and targeted HR placements are your priority.
Function shares come from SOIL's published PGDM placement report for the 2024–26 batch (official placement pages and secondary reports updated Oct–Nov 2026). Review role descriptions and recruiter lists to confirm eligibility for specific functions before making programme choices. Also Read: SOIL Institute of Management Courses & Programs 2026
Caveats: CTC vs take-home, highest package interpretation
The headline CTC figures reported for the SOIL Institute of Management PGDM batch are useful indicators but not direct measures of monthly cash in hand; CTC includes multiple components and the highest package can be an outlier. Readers should treat the published ₹24.8 LPA highest CTC, the ₹11.83 LPA average and the ₹11.80 LPA median for the 2024–26 PGDM cohort as programme-level reporting items rather than guaranteed individual take-home pay.
CTC typically combines fixed pay, variable pay, bonuses, sign-on or joining bonuses, and employer contributions (for example, provident fund or insurance). Fixed pay determines predictable monthly salary; variable components are contingent on performance or company-specific payout schedules. When assessing offers, compare the fixed component and disclosed variable split rather than the headline CTC alone.
The highest package is often a single role and can be skewed by one of the following: a large variable/one-time signing bonus included in CTC, an executive or specialist role offered to a student with prior experience, or an outlier industry hire. For SOIL, the reported highest CTC of ₹24.8 LPA for the PGDM Class of 2024–26 should be read alongside the upper-batch figures—top 25%: ₹14.27 LPA, top 50%: ₹13.48 LPA—which indicate where the stronger half of the cohort clustered.
When using these numbers for budgeting or ROI, prioritise: (1) the fixed annual salary or monthly take-home where disclosed, (2) median and top-half CTCs which reduce distortion from outliers, and (3) role descriptions and location, since cost of living and tax differ by assignment. For programme comparisons, ensure that you compare the same programme and cohort year (PGDM vs PGPM/PGPM-HR have separate reports).
caution: Headline CTC can include variable and one-time components; verify fixed salary and payout structure in the official placement report before accepting any offer.
How to use these numbers to evaluate ROI
Use SOIL Institute of Management placement numbers to compare total cost, realistic earnings and payback time. Start with programme-specific costs, then compare the reported programme CTCs and the likely fixed component you can expect in your role.
| Item | Amount (INR) | Notes |
|---|---|---|
| Total tuition fee (PGDM) | ₹17,20,000 | Reported total fee for PGDM (published Oct 2026) |
| Total tuition fee (PGPM) | ₹15,33,226 | Reported total fee for PGPM (published Oct 2026) |
| Average CTC (PGDM, 2024–26) | ₹11.83 LPA | Official PGDM placement page reported average for 2024–26 batch |
| Median CTC (PGDM, 2024–26) | ₹11.80 LPA | Official PGDM placement page reported median for 2024–26 batch |
| Average CTC (PGPM, Class of 2026) | ₹13.9 LPA | Official PGPM placement page reported average for Class of 2026 |
| Highest CTC (PGDM, 2024–26) | ₹24.8 LPA | Official PGDM placement page reported highest for 2024–26 batch |
Practical interpretation: subtract living costs and expected taxes from a conservative fixed annual salary (use median where available). For a PGDM candidate using the MBA ROI Calculator, input total fee ₹17.20 lakh, annual net salary ₹9.0–9.5 lakh (median CTC adjusted for taxes and variable pay) and living costs to estimate payback in years. A simple payback: net incremental annual income divided into total investment.
For example, if net additional annual take-home is ~₹6 lakh after deductions, a ₹17.2 lakh investment pays back in about 2.8–3 years.
Use programme-specific placement pages and the published batch labels (PGDM 2024–26, PGPM Class of 2026) when calculating ROI; do not mix programme results.
What applicants must verify before deciding
Applicants should confirm a short list of programme‑ and report‑specific facts before treating published placement numbers as decision‑quality evidence. Verify the cohort, the report publication date, the denominator used (students who opted for placement vs entire batch), and whether figures are for the two‑year PGDM or for the one‑year PGPM / PGPM‑HR.
Below is a compact checklist and why each item matters.
| Information to Check | Why It Matters |
|---|---|
| Placement report publication date | Confirms which graduating cohort the numbers cover and whether the data is final or interim; SOIL pages cited were updated in Oct–Nov 2026 for Class of 2026 figures. |
| Graduating cohort/batch label | Ensures you compare equivalent outcomes (the published PGDM figures apply to the 2024–26 batch in the official reports). |
| Denominator: students who opted vs total batch | Placement percentages and averages are often reported for students who opted for placements rather than the entire intake, which affects interpretation of placement rate and averages. |
| Fixed pay vs variable/bonus included in CTC | Distinguishes headline CTC from realistic take‑home and annual guaranteed salary; high CTCs can include variable elements. |
| Programme-specific figures (PGDM vs PGPM/PGPM‑HR) | SOIL reports separate placement pages for each programme; do not combine two‑year PGDM and one‑year PGPM numbers. |
| Job profile and role details | Understanding the function (strategy, consulting, BFSI, IT/ITES) clarifies whether opportunities align with your career goals. |
After checking the table, applicants should cross‑verify the same report on SOIL's official placement pages and confirm the report date and cohort. For admissions and cohort timing details consult SOIL admission 2026: Application & Timeline Explained.
ACTION: Check the placement report publication date and the cohort label before using any CTC figure in your ROI calculation.
Important Points
The PGDM figures cited (highest ₹24.8 LPA, average ₹11.83 LPA, median ₹11.80 LPA) apply to the 2024–26 graduating cohort; verify the institute’s official 2027 report before finalising admission or budget decisions.
- Use programme-specific figures: PGDM, PGPM and PGPM-HR have separate reports and different averages; compare the figure for the programme you intend to join.
- Budget for total cost not tuition alone: include tuition, living expenses and foregone salary when comparing to the reported average CTC ₹11.83 LPA (PGDM, 2024–26).
- Treat the highest CTC (₹24.8 LPA) as an outlier: base salary planning on median (₹11.80 LPA) or top‑50% figures (₹13.48 LPA) for realistic cash‑flow estimates.
- Check placement participation and sample size: reported averages are typically for students who opted for placements, not necessarily the whole batch—confirm counts in the official report.
- Prefer fixed pay when estimating monthly take‑home: CTC includes variable components and benefits; request fixed‑salary breakouts in the institute report or offer letters.
- Compare sector fit with your goals: IT/ITES (33%) and BFSI (30%) dominated the PGDM mix—factor sector salary norms into ROI assumptions.
- Assess role distribution: significant shares in strategy/consulting (23%) and business development (20%) suggest career paths that may require different preparation and offer different progression rates.
- Check reported upper‑batch figures (top 25% ₹14.27 LPA, top 50% ₹13.48 LPA) before using averages to project first‑year net earnings.
- Request the placement methodology and salary component table from SOIL Institute of Management to verify whether CTCs include sign‑on bonuses or stock equivalents.
- If financing is needed, model payback using median or top‑50% CTC rather than the highest package to avoid underestimating repayment pressure.
Placement process and timeline (how campus recruitment works)
SOIL Institute of Management runs a staged placement calendar that begins with career planning and company engagement months before final offers are made; the process is programme-specific and differs for the two-year PGDM and the one-year PGPM/PGPM-HR cohorts. Official placement pages (latest published updates Oct–Nov 2026) show an interim phase where a large portion of the PGDM cohort had offers before the cycle closed and final placement statistics were reported for the Class of 2026.
The typical sequence comprises: profile shortlisting and employer outreach, pre-placement talks and role briefs, company selection with eligibility filters, assessment rounds (case, written, interviews), and offer finalisation. For the PGDM 2024–26 cycle SOIL disclosed an interim placement report in March 2026 that reported near-80% placed before the cycle closed at about 98% of students who opted for placements (published Oct 2026).
Students prepare through career-planning modules, mentoring, mock interviews, resume workshops and industry projects; SOIL's published placement pages describe career-development lectures, leadership sessions and mentoring as formal elements of preparation. Employers typically review resumes, shortlists and conduct multi-stage assessments aligned to function—consulting, BFSI, IT/ITES or manufacturing—so students should match preparation to targeted sectors.
Concise placement timeline (programme differences)
| Activity | PGDM (two-year) | PGPM / PGPM-HR (one-year) |
|---|---|---|
| Employer engagement | Begins months before final year (interim phase reported Mar 2026) | Lateral recruitment aligned to experienced-hire cycle; final placements reported for Class of 2026 |
| Assessment formats | Case, group, interviews, written tests | Case, interviews, role-based assessments |
| Placement closure | Finalised by end of placement cycle (final report published Oct 2026) | Final report published for Class of 2026 (Oct 2026 updates) |
Interpretation: treat the interim disclosures and staged offers as normal—early offers reduce pressure but final figures reflect the closed cycle. Applicants must check the programme-specific placement page for the cohort they will join and align their preparation to the sector and function mix SOIL reports for each programme.
Important Points
- Programme scope Placement figures quoted are programme-specific; the PGDM 2024–26 batch figures apply to the two-year PGDM only.
- Reported averages The published PGDM average CTC for the 2024–26 batch is ₹11.83 LPA; use the programme label when comparing.
- Median and percentiles The published PGDM median CTC is ₹11.80 LPA; the top 25% and top 50% CTCs are ₹14.27 LPA and ₹13.48 LPA respectively.
- Highest offer The published PGDM highest CTC for 2024–26 is ₹24.8 LPA; treat this as an upper-bound illustrative figure, not a typical outcome.
- Sector split IT/ITES and BFSI together formed approximately two-thirds of reported hires (published shares: 33% IT/ITES, 30% BFSI).
Take the next step: Start your MBA journey today by exploring colleges that match your profile, analysing your admission chances and estimating programme ROI. Use the College Shortlister, run your profile through the Profile Analyzer, or estimate returns with the MBA ROI Calculator.
Similar Colleges to Check
Compare these colleges alongside SOIL Institute of Management Placements 2027 before you finalise your shortlist.
| College | What to compare |
|---|---|
| SOIL Institute of Management | Fees, cut-offs and placements |
| SOIL Institute of Management | Fees, cut-offs and placements |
| SOIL Delhi | Fees, cut-offs and placements |
| SOIL Gurgaon | Fees, cut-offs and placements |
| SOIL School of Business Design | Fees, cut-offs and placements |
Related Reads
Frequently Asked Questions
Which programme do the SOIL Institute of Management placement figures refer to?
The placement figures in the published PGDM report apply specifically to the two-year PGDM batch of 2024–26. SOIL publishes separate placement reports for its one-year PGPM and PGPM-HR programmes.
What were the highest, average and median CTCs reported by SOIL for the latest PGDM batch?
The published figures for the PGDM 2024–26 batch are: highest CTC ₹24.8 LPA, average CTC ₹11.83 LPA, and median CTC ₹11.80 LPA.
How much of the batch was placed and does the placement rate include students who did not opt for placements?
SOIL reports placement percentages against students who opted for placements. For the PGDM Class of 2026 the published placement rate for those who opted was reported as 98%; the opted subset was 93% of the full batch according to the published report.
Which sectors hire most SOIL graduates and what functions are commonly offered?
Published sector shares for the PGDM 2024–26 cohort show IT and ITES at 33% and BFSI at 30%. Function-wise, strategy & consulting (23%), business development (20%) and general management (17%) were the largest buckets.
How should I treat the highest package when estimating my expected salary?
Treat the highest CTC as an illustrative upper-bound. Use the median and top‑quartile figures (published: median ₹11.80 LPA, top 25% ₹14.27 LPA) to form more realistic expectations and base ROI calculations on the fixed-pay component where available.
Are PGPM and PGPM-HR placement figures reported separately from PGDM?
SOIL publishes separate placement pages. Published figures show the PGPM Class of 2026 average at ₹13.9 LPA and the PGPM-HR Class of 2025 average at ₹11.2 LPA, distinct from the PGDM numbers.
Conclusion
The published placement report for the SOIL Institute of Management PGDM 2024–26 batch provides programme-specific benchmarks: a highest CTC of ₹24.8 LPA, average CTC of ₹11.83 LPA, median of ₹11.80 LPA and upper‑batch figures (top 25% ₹14.27 LPA, top 50% ₹13.48 LPA). Applicants should treat these as historical reference points, verify the official 2027 cohort report when available and weigh salary distribution, role fit and total cost when estimating ROI.
About MBA Compass
MBA Compass is an MBA discovery and decision platform produced by B School Buzz. It helps Indian students and working professionals shortlist colleges, compare programmes and understand the financial implications of management education. The platform combines data-driven college shortlists, a profile analyser that maps scores and experience to realistic admission chances, and tools to compare fees, scholarships and expected packages.
MBA Compass focuses on decision-critical metrics such as total fees, living costs and projected post‑MBA earnings so candidates can assess return on investment and long-term wealth outcomes before committing to a programme. It also offers tailored resources for interview preparation and programme selection to support practical admission decisions.